| Sliding MinPD |
|
Building evolutionary networks of serial samples via a recombination detection approach |
|
Home | Features | Supplementary Material | Source Code |
|
[ Simulation Studies | Network Construction | Patient 8 ML Tree ] |
| Supplementary Material: Patients' Networks |
|
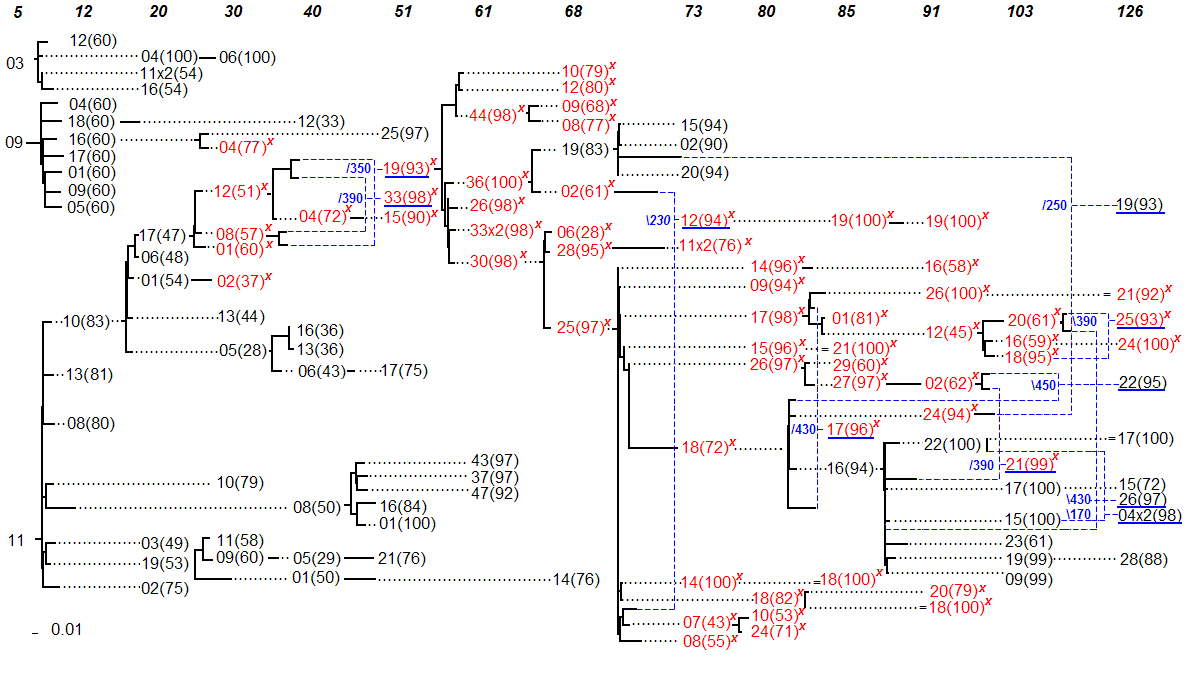
This section describes the settings, parameters and guidelines for the construction of the consensus serial evolutionary network of Shankarappa's patient 2 and patient 8 [1]. It also contains an analysis of the network information. The focus here is on patient 2, also described in the first version of MinPD [3]. Patient 8 is described in the Sliding MinPD paper. The network of patient 2 is shown below and may be viewed in enlarged from by clicking on it.
Figure 2. Consensus Serial Evolutionary Network showing the relationships of serially sampled HIV-1 sequences from patient 2 of Shankarappa’s study[1]. The sequence IDs have been shortened to decrease the amount of clutter and to make space for the bootstrap values shown in parenthesis. The IDs are unique within a sampling point (shown on top), but not across the whole serial evolutionary network. For example, the GenBank ID of p2c005-03 is shortened as 03 under the sampling time 5 months. Solid lines indicate distances, while dotted lines serve to extend the linking relationships. Sequences with a mutation predictive of the X4 phenotype are written in red font and also marked with a red “x”. Blue dashed lines are used to link recombinant sequences with their predicted donor sequences. The small numbers in blue next to branch points in the tree are the predicted (approximate) recombination breakpoint positions.
Constructing the Consensus Serial Evolutionary Network The Shankarappa99 data set was made available at GenBank and the HIV Los Alamos database. Two hand-aligned versions of the data set were made available from the URL: http://www.cebl.auckland.ac.nz/~hros001/HIVpossel/, as supplementary material for the work of Ross and Rodrigo, who used the data to study immune-mediated positive selection driven by HIV-1 molecular variation
[2]. Both versions were available in the PAUP Nexus format and were separated into subsets, each corresponding to a single patient. One version was a gapped, hand-aligned file of the entire Shankarappa99 data set (separated into lists by patients), where gaps signified insertions or deletions
[2]. The length of the sequences was 786 nucleotides. The second data set contained a gap-balanced alignment of each of the subsets of the same data. Gaps had been removed from this data set in a “balanced” manner, i.e., such that codon alignments were preserved. Both the data sets, gapped and gap-balanced, were aligned against reference HIV sequences (HIV-1 type B accession numbers K03455, M17451, U63632, and U21135) from the Los Alamos database. The sampled sequences corresponded to amino acid positions 342 to 594 in the reference sequences. The data
set of patient 2 was then analyzed using Sliding MinPD. The Nexus files were converted to aligned files in FASTA format, as required by Sliding MinPD. Duplicate sequences from the same sampling point were removed as they represented the same ancestral sequence, retaining just one copy, but marked with an x followed by the number of duplicate copies. Thus “11x2” from
the figure refers to two copies of sequence 11 from the sampling time point 20.
The consensus file was created manually from the 6 results files by applying the consensus rules specified above. A computational tool that constructs the serial evolutionary network from (the manually created) consensus file containing the ancestor-descendant relationships and an input of aligned sequences was developed. The network builder generates the collection of Neighbor-Joining trees using the same procedure as in Sliding MinPD and according to the chosen relationships in the consensus file. The Neighbor-Joining trees were used to draw a single HIV-1 serial evolutionary network that reflects the consensus result of the previously obtained 6 results. Network Description The serial evolutionary network of patient 2 was manually drawn using the visualization approach, described in [3]. A short summary of the guidelines used for drawing and interpreting the graphs is given below:
The new method, Sliding MinPD, outputs additional values of importance, such as statistical bootstrap support values. The bootstrap values provide statistical significance scores for the ancestor-descendant predictions. When the program has to choose between highly similar sequences the bootstrap values may be low, signifying that the results are less conclusive. Due to the value of this information it was necessary to incorporate it in the network representation. Besides the guidelines summarized above, the changes/additions to the network representation are as follows:
Analysis of the Network Information Sliding MinPD was applied (using the default options) to serially-sampled HIV-1 data of patient 2 from the 1999 Shankarappa study
[1]. In a previous study featuring the method MinPD, the network of patient 2 (labeled as patient S in that study) was presented and discussed in
detail [3]. Here we will present the serial evolutionary network produced by the improved method, Sliding MinPD. We will therefore start the discussion by analyzing the differences between the two results. For this discussion, we will use the complete ID of the sequences as it appears in Genbank. The name includes the patient information, which appears as “pX” for patient X, followed by the information on sampling time, which appears as “cN” for time period N months since seroconversion, followed by a dash, and a ID number unique within that sampling period. For example p2c51-19 refers to sequence with ID 19 sampled at 51 months from patient 2. A suffix of “x” followed by a number n indicates that the same sequence was sampled n times during the same sampling time point. A suffix of “g” indicates that a duplicate was only found in the gap-balanced alignments. The information about the health status of the patients, the therapy administered to each, and the CD4+ T-Cell counts were obtained from published results
[1] The two networks, one obtained by applying MinPD and the other obtained by applying Sliding MinPD were compared. They were found to be similar when considering the splitting of lineages, and showed some differences with respect to the identification of recombinant sequences. As in the earlier MinPD network [3], up to the 51-months sampling period there were three different lineages. Also like before, one lineage ceased to exist at that point with sequence p2c51-25 as its last sampled sequence. As shown in the earlier MinPD network, another lineage with the last sampled representative as p2c68-14 disappeared at 68 months. After 68 months both networks showed no distinct lineages, with clear indications of the occurrence of recombination events. As suggested by both networks, the X4 mutation that was widespread in most sequences sampled later appears to have descended from p2c61-30 and its putative ancestor p2c51-19. However, the two methods disagreed on whether or not the sequence p2c61-30 or p2c51-19 was a recombinant. Although the RIP option in Sliding MinPD continued to identify this sequence as a recombinant, the other methods did not. In particular, the gap-balanced version of B-RIP suggested that sequence p2c51-19 was the only donor with a bootstrap support of 98%. As for the donors of sequence p2c51-19, two of the results, the ones using the SB and B-RIP options, suggested that it was a recombinant sequence. However, the two methods disagreed on the donors (Left:p2c30-12 and Right:p2c40-08 versus Left:p2c30-01 and Right: p2c40-01); a majority of the other results identified sequence p2c30-05 as the only donor, albeit with low bootstrap support. The B-RIP answer was chosen, because it had the highest bootstrap support and also because B-RIP results are given higher consideration as specified in the consensus rules guidelines. A recombinant history makes more sense because of its X4 mutation. It is worth pointing out that the original MinPD initially identified a large number of potential recombinants, but only a few were added to the network after doing additional analysis using the Bootscanning program Simplot [4]. As a majority consensus rule was used to choose recombination events in Sliding MinPD, which gives priority to the B-RIP method, the recombination results were quite different in the resulting network. The networks suggest an increase in recombination activity in the later sampling periods. This coincided with a decrease in the number of CD4 T-Cells. More importantly, it also coincided with the start of the antiretroviral drug therapy at the 103rd month period. In fact, the largest number of recombinants (with strong recombination signals) were found during the last sampling period after the patient started taking three different drugs. These drugs included Zidovudine- ZDV, Lamivudine-3TC (which the patient stopped taking at 120 months), and Stavudine-d4T (which was continued until the 126 months period). An interesting recombination event was suggested for sequence p2c126-19 with a putative left-side donor of p2c68-19, which was sampled almost 5 years earlier, and which was from a different lineage and did not carry the X4 mutation. This hints at the existence of dormant viruses that escape latency and recombine with viruses from the dominant population. References [1] Shankarappa, R., Margolick, R. B., Gange, S. J., Upchurch, D., Farzadegan, H., Gupta, P., Rinaldo, C. R., Learn, G. H., He, X., Huang, X.-L., and Mullins, J. I. (1999). Consistent viral evolutionary changes associated with the progression of HIV-1 infection. J. Virol. 73:10489-10502. [2] Ross, H. A. and Rodrigo, A. G. (2002). Immune-mediated positive selection drives Human Immunodeficiency Virus Type 1 molecular variation and predicts disease duration. J. Virol. 76:11715-11720. [3] Buendia, P. and Narasimhan, G. (2004). MinPD: Distance-based Phylogenetic Analysis and Recombination Detection of Serially-Sampled HIV Quasispecies. Proc. IEEE Comput. Sys. Bioinform. Conf., Stanford, CA [4] Ray, S. (2003). SimPlot for Windows 3.4. |