| Sliding MinPD |
|
Building evolutionary networks of serial samples via a recombination detection approach |
|
Home | Features | Supplementary Material | Source Code |
|
[ Simulation Studies | Network Construction | Patient 8 ML Tree ] |
| Supplementary Material: Simulation Studies |
|
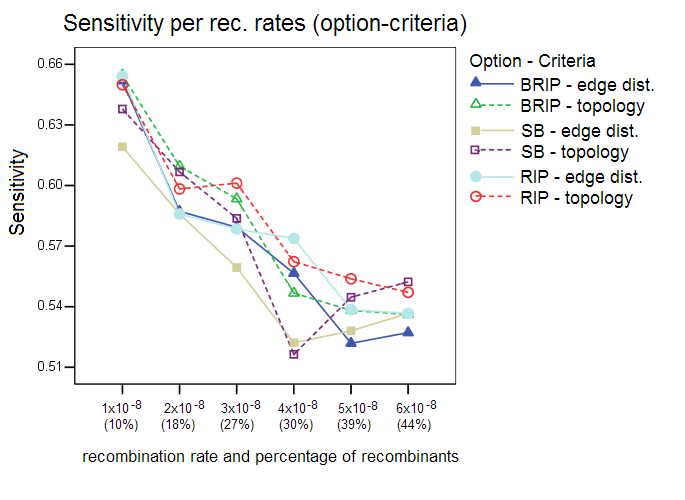
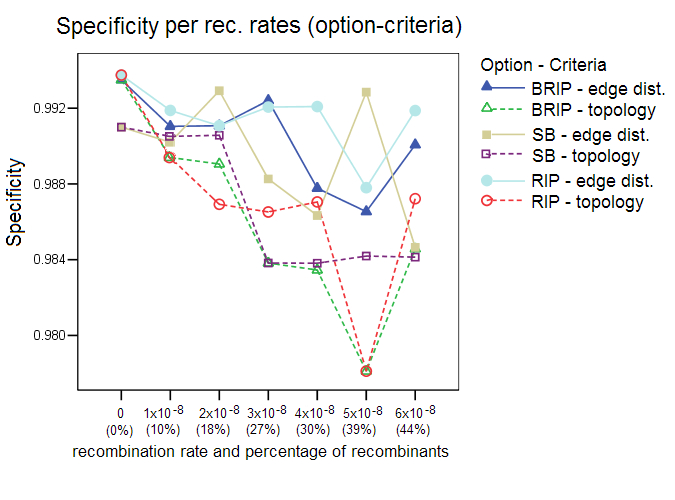
This section shows additional results of the simulation studies with Sliding MinPD which are not reported in the paper. Serial NetEvolve 1.0 was used to generate data sets with 7 different recombination rates. The sequence length was set to 1000, the model of evolution to HKY, with the rate heterogeneity alpha parameter set to 0.5, mutation rate to 0.00001, internal node sampling rate to 0.5, and exponential rate to 0.0005. Breakpoints were added uniformly between the positions 150 and 850, the breakpoint margins. A sample size of 8 sequences per sampling time was chosen with 6 sampling time points, which resulted in a sequence alignment containing 48 sequences, of which 8 were from the first sampling period. Sliding MinPD was then used to identify the recombinants among the 40 query sequences and to determine the closest ancestors for parts of or the entire length of the sequence. Sliding MinPD was run repeatedly on the data sets with different combinations of parameters in order to evaluate the best choice of program parameters. Cutoff values for the analysis of the empirical data were chosen so as to maximize Sliding MinPD’s success using a cross validation approach in which the program was tested on different test datasets (different models of evolution, mutation rates and recombination rates) using fixed parameters. Specificity (SP), sensitivity (SE) and positive predictive values (PPV) were calculated for each combination of the parameters used for Sliding MinPD. The BKP Score gives the percentage of breakpoints that were correctly identified (a margin of error of 60 nucleotides was allowed for the breakpoint position predictions)The default values for SB and B-RIP were: 100 bootstrap replicates, a window size of 200, a step size of 20, and a seed of -3. The default PCC threshold values were set to 0.4 for B-RIP and RIP, and 0.2 for SB. The default bootstrap thresholds were 88 for SB and 90 for B-RIP. The default values for the RIP option were: a window size of 100 and a step size of 30. All three options used the TN93 distance and an alpha parameter of 0.5. Six different recombination rates were used, namely 1x10⁻⁸ (10%), 2x10⁻⁸ (18%), 3x10⁻⁸ (27%), 4x10⁻⁸ (30%), 5x10⁻⁸ (39%), and 6x10⁻⁸ (44%); the parenthesized percentage values correspond to the rough percentage of sequences that were recombinant. ResultsProgram options and evaluation criteria: The three different program options as well as the 2 different evaluation criteria were tested for different recombination rates. Overall, the standard bootscan (SB) option, which uses phylogenetic trees to compute the answer, performed better when the topology evaluation criterion was applied on data sets with low recombination rates. A slight decrease in the specificity values was observed when the methods were evaluated with the topology criterion, however this also caused an increase in the sensitivity scores. The sensitivity score fell dramatically for larger recombination rates. In all of the following tests the SB option was always used in conjunction with the A-D topology criterion, and the RIP and B-RIP options in conjunction with the A-D path length criterion.
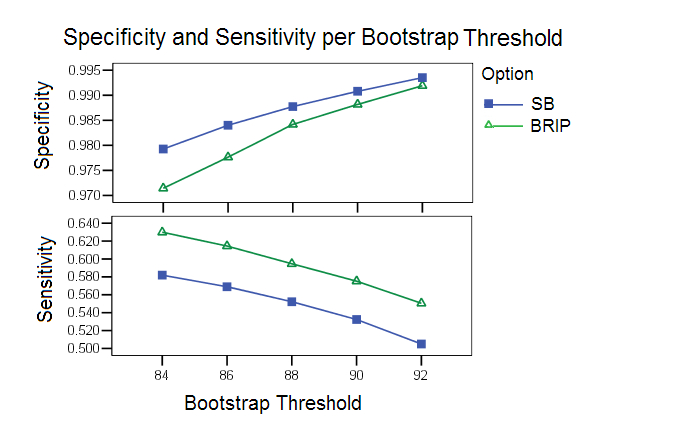
Bootstrap Threshold: As has been observed in many studies, an optimal calibration of the parameters is difficult because of the delicate balance between sensitivity and specificity. The bootstrap study highlights this point clearly. With higher bootstrap thresholds the specificity increases but the sensitivity decreases. Based on this study bootstrap thresholds of 88 and 90 were chosen as default values for SB and B-RIP options respectively.
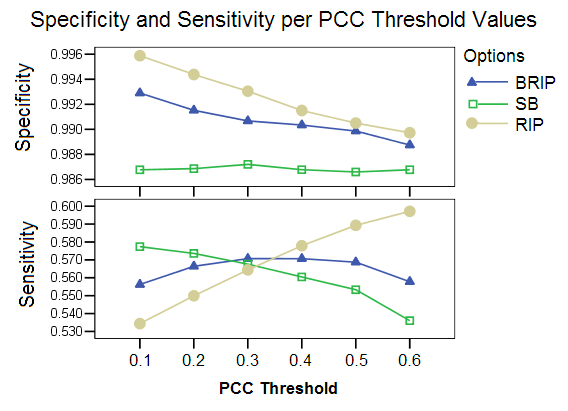
PCC Threshold:This study shows the effect of different PCC threshold values on the selection of an appropriate pool of donor candidates. The three options show very different levels of performance for the different threshold values. The RIP option is highly affected by this parameter, with the specificity falling and sensitivity increasing for higher threshold values. A high threshold value reduced the pool of candidates only minimally. The SB option appeared to be at an advantage for very low threshold values, which greatly reduces the pool of candidates.
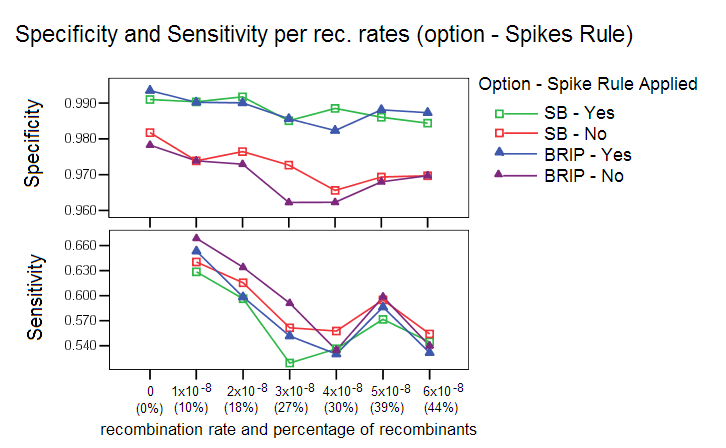
Spikes Rule for reduction of Candidate Pool: This rule is applied by default to discard false positives with short bootstrap spikes or weak bootstrap spikes. An increase in the number of false positives was observed when such sequences were left in the candidate pool, see image below. A bootstrap spike is defined as a segment of consecutive windows in which a given sequence has a higher bootstrap value than the other sequences. If the spike lasts less than 100 nucleotides (or the number of windows that covers this length), it is probably an artifact of the bootstrap procedure. If the spike is not high enough, then the sequence can’t be considered a candidate for recombinant ancestor.
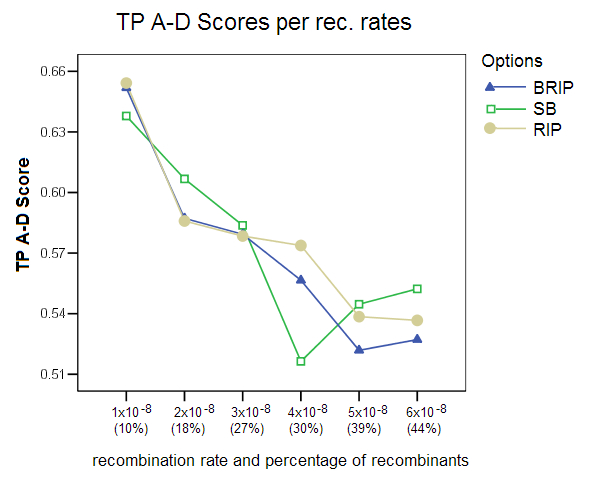
True Positives (TP) A-D Score: This score shows the percentage of predicted ancestral donors that matched the true ancestors for recombinant predictions. The score is clearly affected by the choice of the recombination rate, with the score falling from 65% to an average of 53% for the higher recombination rates.
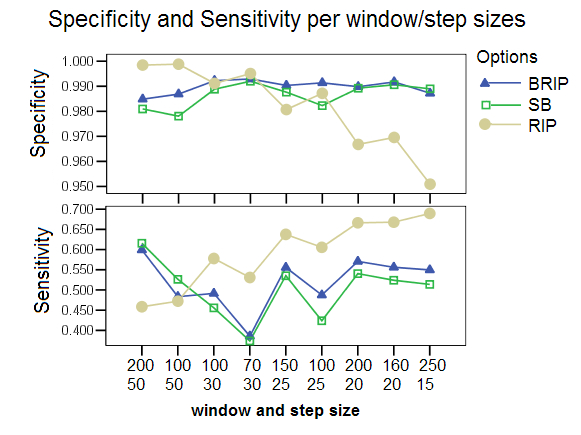
Different Window and Step Sizes: Different combinations of window and step sizes were chosen for comparing the three program options. The X-axis shows combinations of window sizes (top) and step sizes (bottom) ordered by increasing number of windows. B-RIP and SB showed improved performance at the default window size of 200 and step size of 20. The RIP option however was drastically affected by the choice of these parameters, with lower specificity and higher sensitivity for the smaller step sizes, and higher specificity and lower sensitivity for larger step sizes. The default values chosen for RIP in all other studies were a window size of 100 and a step size of 30. The RIP performance can be explained by the observation that it does not generate bootstrap replicates and that therefore the distance values between windows fluctuate more for larger step sizes when the sequences are sufficiently divergent (default mutation rate: 0.00001) and the distances are not averaged over all bootstrap replicates. The study also shows that smaller window sizes negatively affected the sensitivity but improve the specificity values of all options, but specially that of SB and BRIP
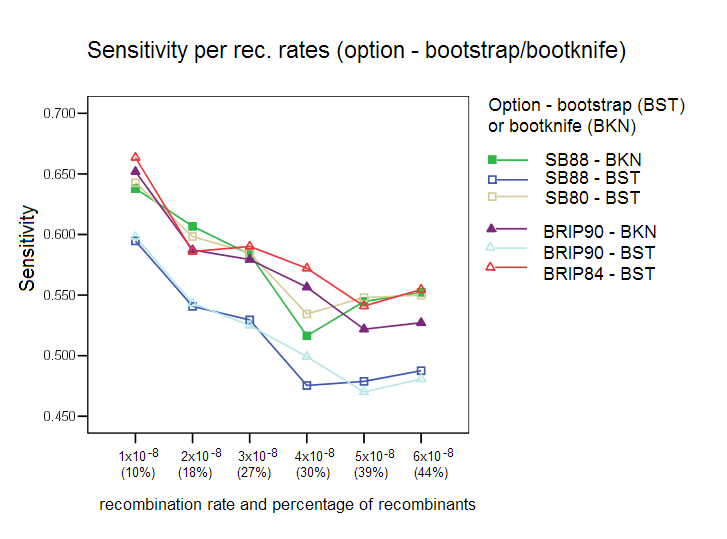
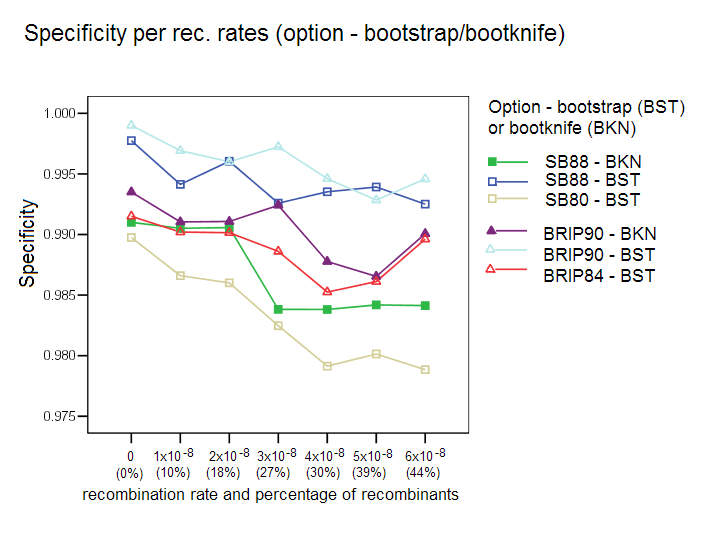
Bootstrap/Bootknife Comparison: The three options with their respective default values were tested with the standard bootstrap and with the bootknife method (described in the algorithms section). Each of the three options was tested with the two bootstrap procedures (label is used BKN for bootknife, and BST for the standard bootstrap). Our results show that the bootknife procedure is marginally better, thus justifying its choice as the default option for the other comparison studies reported here.
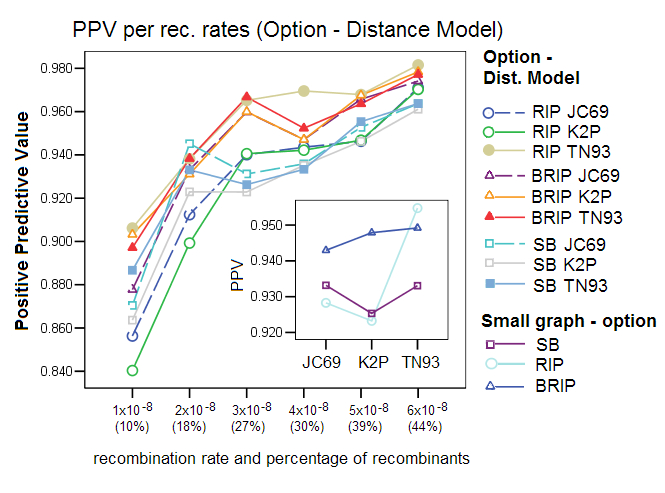
Corrected Distance Models: We compared the effect of using one of the three different distance formulas, a setting in Sliding MinPD: Jukes Cantor 69 (JC69), Kimura-2-Paramter (K2P), and Tamura Nei 93 (TN93). The results show that the choice of a distance model affected the performance of the different options, with TN93 showing the best results for all three options. RIP was especially affected by the choice of distance formula. This gives evidence to the robustness of the bootstrap process, which balances out substitution effects that are misinterpreted by the simpler distance models.
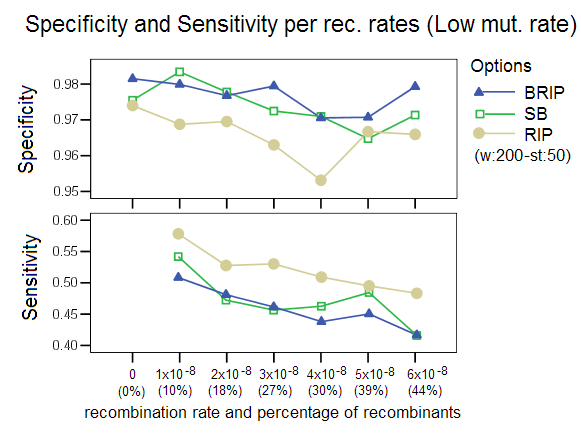
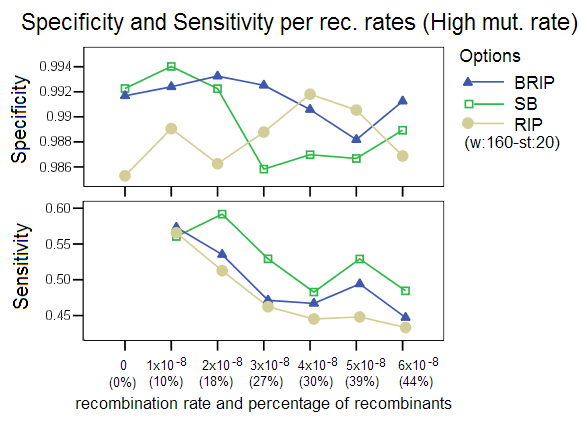
Low and High Mutation Rates: This study compared the effect of simulating data with a different mutation rate, a setting in Serial NetEvolve. Posada and Crandall [1] used mutation rates in the range of 0.0000025 to 0.00005, while the default value of our simulations is 0.00001. Our results are comparable to the Posada and Crandall study for the low mutation rate (0.0000025). The methods perform poorly with sequence data that has low divergence. This observation with regards to low mutation rates extends to all phylogenetic tools. The option RIP was ran with a different window size of 200 and a step size of 50 as the default settings returned very poor results. This again proves that the bootstrap process (not part of RIP) imparts robustness to the detection process. Our studies showed that too high a mutation rate (0.00005) also caused a decrease in performance of the different detection options, with RIP especially affected. RIP was ran with a window size of 160 and a step size of 20, settings that are known to increase this options’ sensitivity. This decrease in performance was not observed in the Posada and Crandall study, but as stated before, their study did not involve identification of recombinant sequences and donor sequences, but only measured the presence or absence of recombination in a data set. The two studies are therefore not easily comparable.
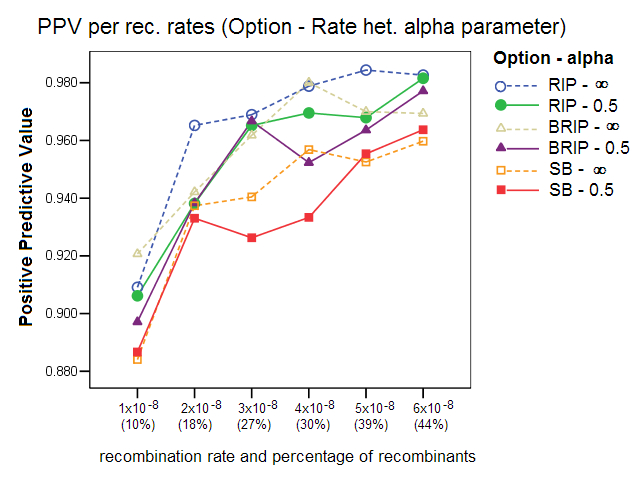
Rate Heterogeneity Parameter: This study compared the effect of simulating sequence data with a homogenous mutation rate across all sites (alpha parameter = ¥) to that of simulating sequence data with a gamma rate heterogeneity (alpha parameter =0.5). The rate heterogeneity parameter is a setting in Serial NetEvolve, not in Sliding MinPD. To evaluate the power of the different recombination tests, Posada and Crandall generated data with homogenous rates, which as our results show, improve the recombination detection performance of the different options, with the specificity, sensitivity and positive predicative values clearly improving.
[1] Posada, D. and Crandall, K. A. (2001). Evaluation of methods for detecting recombination from DNA sequences: computer simulations. Proc. Natl. Acad. Sci. U. S. A. 98:13757-62 |